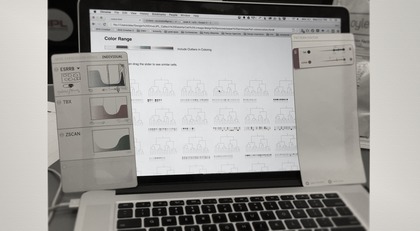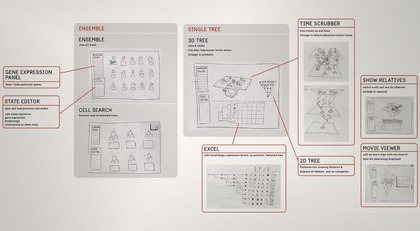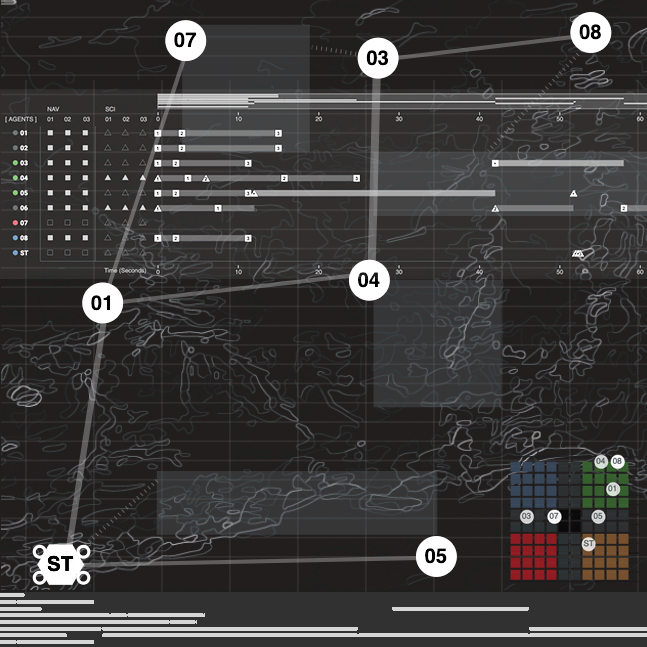
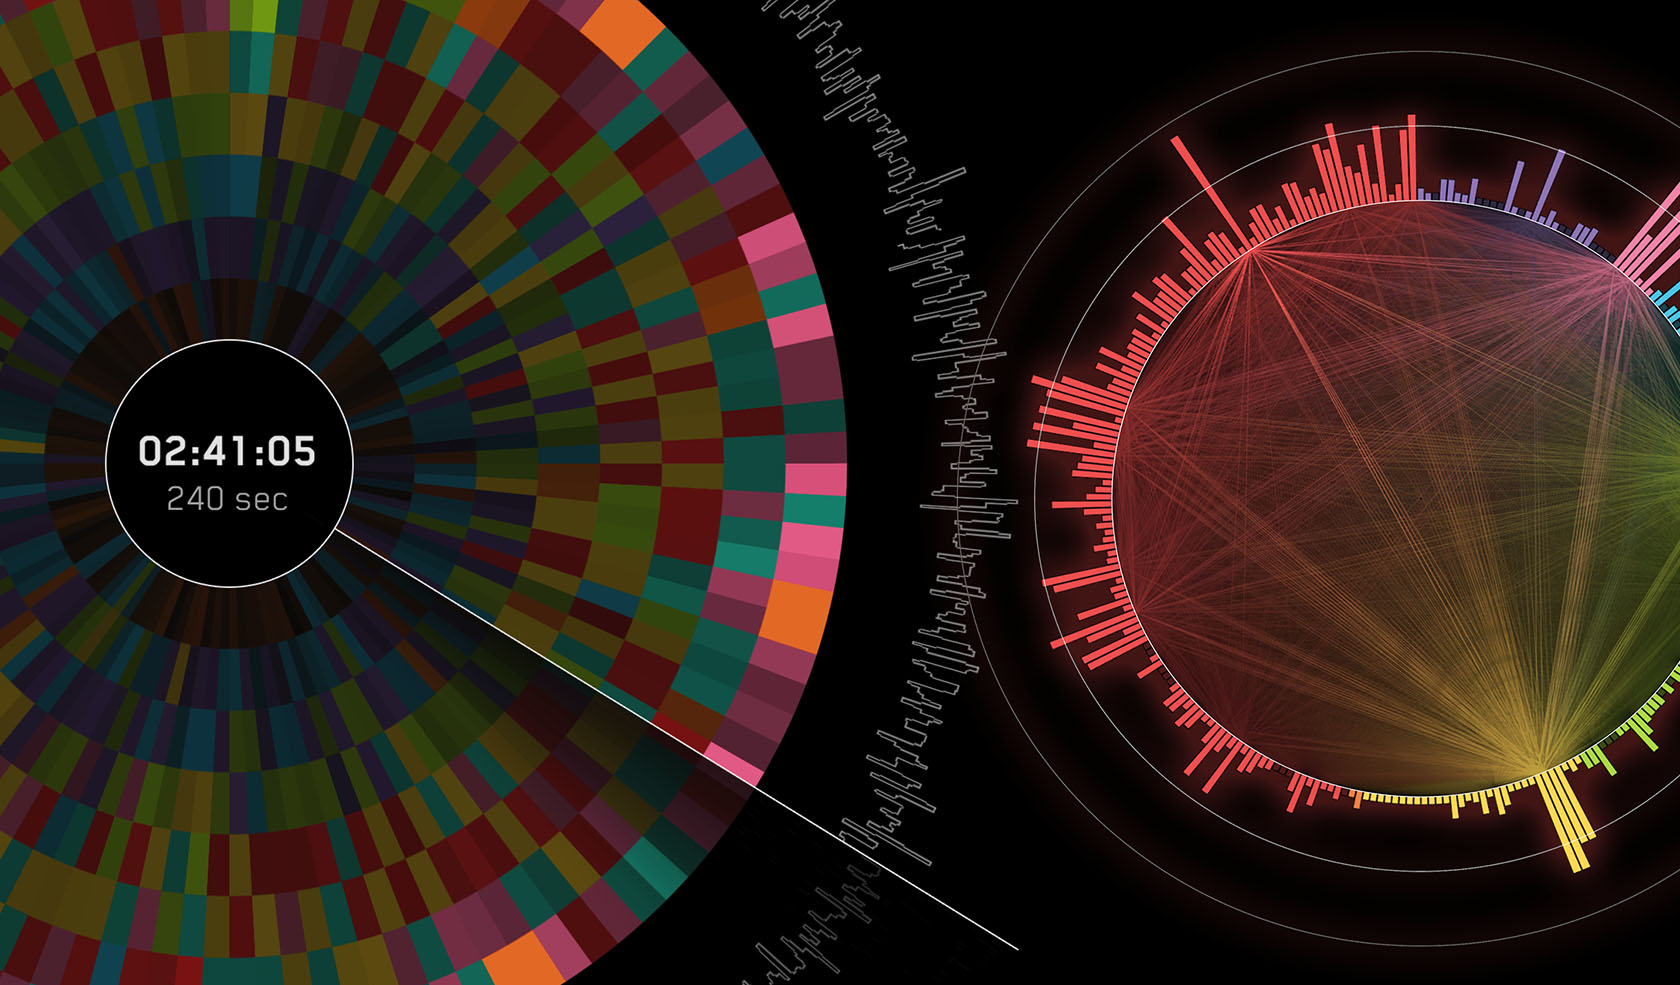
MOSAIC VIEWER: AUTONOMOUS AGENT NETWORK SCHEDULER INTERFACE
| Joshua Vander-Hook, Federico Rossi, JPL Robotics
Engineering challenge: Visualizing the scheduling and performance of a set of multiple autonomous agents
Visualization challenge: Connecting complementing views of state of network/system to allow insight on operation.
Visualization solution: An at-a-glance overview of system’s state by enabling a high-level synthesis, cross-comparison, and analysis on the agents’ health, performance, and other agent-centric metrics.
Outcomes: LINK : http://alessandrafleck.com/project08.html
INTERNS: Sandra Bae, Alessandra Fleck
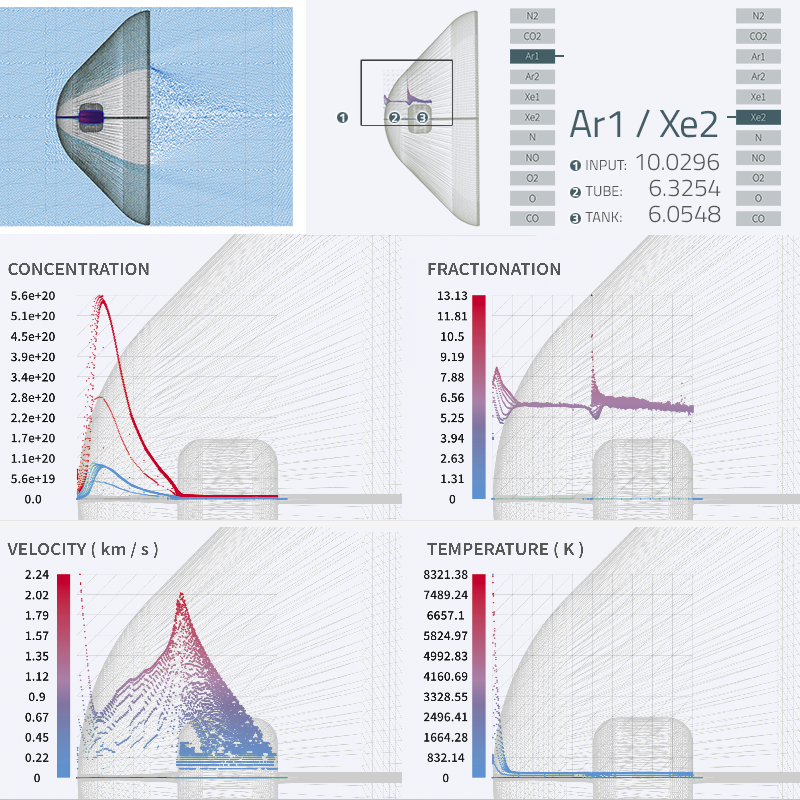
FRXN8: GAS SAMPLING FRACTIONATION INSPECTOR
| Morgan Cable | Jason Rabinovitch, JPL Instrument Systems Implementation and Concepts
Engineering challenge: Verify composition of sampled gas from the upper atmosphere of venus.
Visualization challenge: Demonstrate the impact of hypervelocity on the composition samples given complex stochastic simmulations.
Visualization solution: Concurrently display several panels with different resulting variables onto 1D and 2D projected compositions on top of spacecraft and collecting infrastructure geometry.
Outcomes: LINK : http://alessandrafleck.com/project05.html
INTERNS: David Abramov, Alessandra Fleck
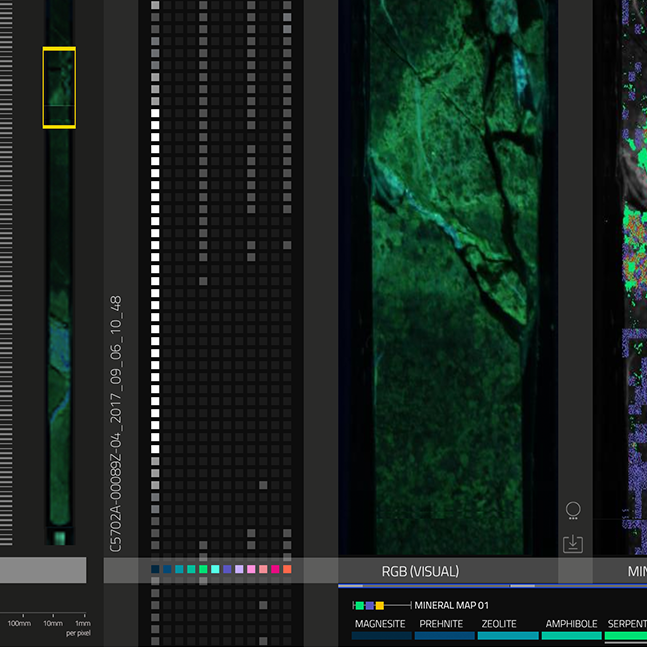
COR3INSPECTOR: OMAN CORE EXPLORATION INTERFACE
| Bethany Ehlmann, Rebecca Greenberger, CALTECH GPS
Engineering challenge: Operationalization of kilometers of short-wave near-infrared micro- spectroscopy core images.
Visualization challenge: Facilitating research on the creation and modification of the oceanic crust and mantle.
Visualization solution: Intuitive interface furnished to enable search of patterns, analysis of core sections, curation and annotation of found features, an interactive creation of complex multi-channel/multi-mineral maps.
Outcomes: LINK : http://alessandrafleck.com/project06.html
INTERNS: Aspen Hopkins, Alessandra Fleck
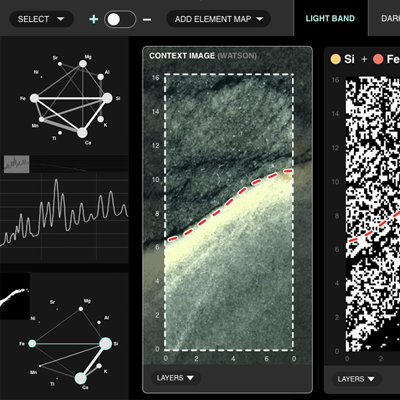
PIXLATE: PIXL INSTRUMENT FRONTEND
| David Flannery, JPL Planetary Chemistry and Astrobiology
Engineering challenge: Quickly viewing and analyzing microXRF data from MARS 2020 rover's PIXL instrument to enable research
Visualization challenge: Enabiing investigation of the composition, spatial patterns, and geological history of rock samples.
Visualization solution: PIXLATE enables the generation, cross-comparison, and analysis of 2D element maps, x-ray spectra, & novel correlation diagrams.
Outcomes: LINK : http://adriangalvin.space/pixelate : LINK : https://www.davidschurman.com/pixelate
INTERNS: David Schurman, Adrian Galvin, Pooja Nair
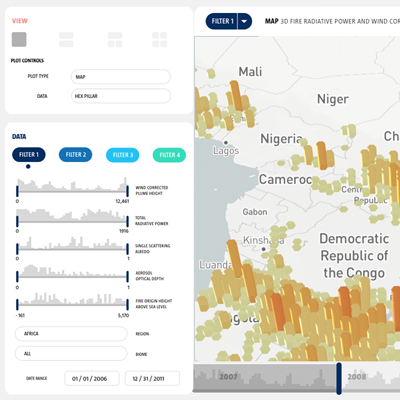
MERLIN: FIRE PLUME DATABASE INTERFACE
| Michael Garay & Abigail Nastan, JPL MISR Group
Engineering challenge: Creating more widely accessible, explorable representations of NASA's MISR instrument fire plume data
Visualization challenge: Allowing researchers to filter, investigate, and intuitively visualize fire plume.
Visualization solution: MERLIN allows researchers explore and drill down on the complete fire databased based on geography, plume height, fire radiative power, and other appurtenant metrics.
Outcomes: NEWS: Seeing Science. JPL : LINK : https://www.jpl.nasa.gov/edu/news/2018/10/15/seeing-science-using-visualizations-to-help-nasa-study-wildfires/ : LINK : http://adriangalvin.space/merlin
INTERNS: Jarod Boone, Adrian Galvin, Pooja Nair
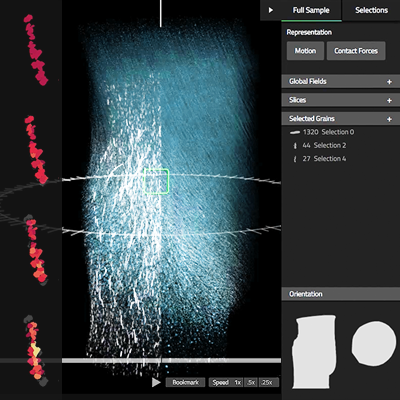
GRVIN: GRAIN ASSEMBLIES VISUALIZATION & ANALYSIS
| Dr. Jose Andrade, CALTECH CME
Engineering challenge: Helping researchers understand the underlying physics within granular materials through visualization.
Visualization challenge: Displaying clear 3D visualization of forces and other dimensions associated with grain experiments.
Visualization solution: GRVIN enables efficient 3D visualization of experiments with affordances for both high level and grain-scale analysis.
Outcomes: LINK : http://adriangalvin.space/grain
INTERNS: Jeff Brewer, Adrian Galvin, Pooja Nair
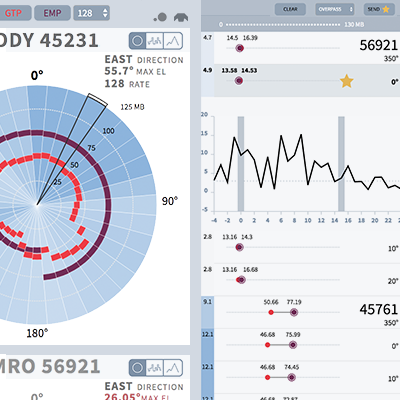
MERIDIAN: MARS TELECOMMUNICATIONS RELAY ANALYSIS
| Victoria Scarffe-Barrett, NASA/JPL Mars Exploration Rover Team
Engineering challenge: Report, visualize, and offer an analysis tool for Opportunity rover telecommunications.
Visualization challenge: Visualizing and comparing predictions of telecomunnications across channels, times and locations.
Visualization solution: A user-friendly system for analyzing telemetry predictions, allowing for quick informed decisions making, and optimization of path of the rover given all constraints.
Outcomes: PUBLICATION: Towards Design Principles for Visual Analytics in Operations Contexts. Proceedings of the 2018 CHI Conference on Human Factors in Computing Systems. April 2018. ACM. : PDF : https://idl.cs.washington.edu/files/2018-Meridian-CHI.pdf : VIDEO : https://www.youtube.com/watch?v=qyi6YPsqjU8
INTERNS: Mathen Conlen, Chelly Jin, Sara Stalla
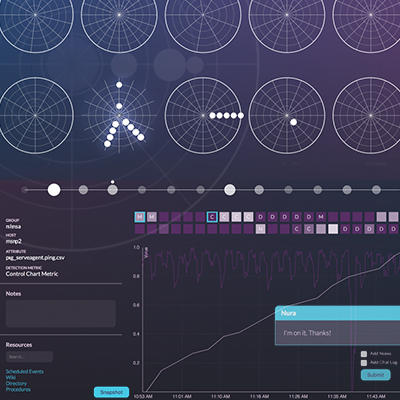
CONSTELLATION: CYBERSECURITY SYSTEM IN REALTIME
| Dr. Arun Viswanathan, JPL Cyber Defense Engineering
Engineering challenge: Offer ground support from JPL's cybersecurity anomalies.
Visualization challenge: Visualize the health state of JPL's MSL network enabling anolmaly discovery and tracking
Visualization solution: Tool that offers at a glance as well as detailed information of system, utilizing a plugin detection algorithms system, inside an interactive visualization to monitor and inspect anomalous attributes.
INTERNS: Fred Hohman, Chelly Jin, Sara Stalla
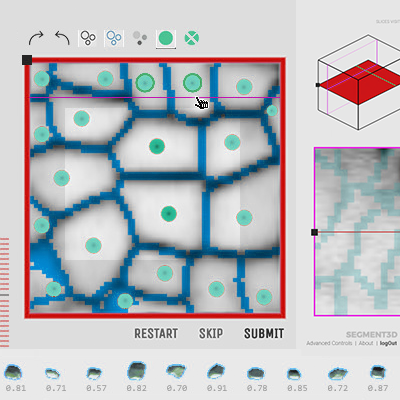
SEGMENT3D: 3D CELL IMAGE SEGMENTATION
| Dr. Elliot Meyerowitz & Dr. Alex Cunha, Caltech Biology & CD3
Engineering challenge: Enabling visual segmentation of three dimensional plant cells embedded in volume.
Visualization challenge: Overcoming 2D limitations of interface while giving a sense of locatino, completion, and quality control.
Visualization solution: A web based tool, that allows users to identify cell boundaries by brushing across tandem views of intersecting 2D slices within a carefully crafted 3D context with immediate result feedback.
INTERNS: Beatrice Jin, Chelly Jin, Sara Stalla
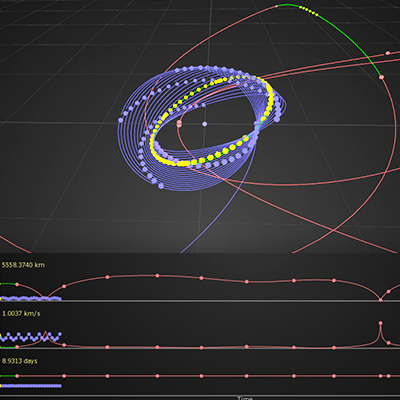
SPACECRAFT TRAJECTORY DESIGN
| Jeffrey Stuart, Scott Evans, JPL Mission Design Navigation Group
Engineering challenge: Fly spacecraft efficiently to points of scientific interest.
Visualization challenge: Make high-dimensional trajectory design more tractable through interactive visualization.
Visualization solution: A visual tool offers intuitive interaction with 3D and 2D representations of trajectories with quantitative data query options.
Outcomes: NEWS : http://www.caltech.edu/news/visualization-brings-data-life-52802
INTERNS: Andrew Cox, Aprameya Mysore, Shixie
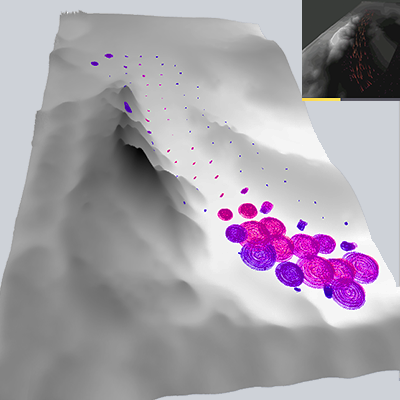
GLACIER ICE FLOW
| Dr. Mark Simons, Caltech Geophysics
Science challenge: Understand glacier flow and variability at different timescales.
Visualization challenge: Visually represent the movement of ocean tides and inland Antarctic ice streams over varying timescales.
Visualization solution: An interactive tool generates a unified visualization of velocity in space and time and supports exploration of quantitative data.
INTERNS: Matthew Edwards, Aprameya Mysore, Shixie
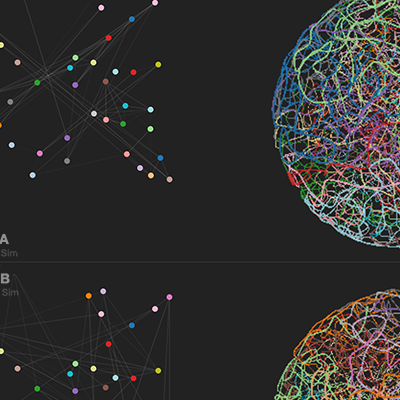
3DDNA
| Dr. Mitch Guttman, Caltech Biology/Bioengineering
Science challenge: Understand the activity of genes in proximity to one another due to folds in the genome.
Visualization challenge: Represent the 3D structure of DNA to support exploration of new relationships to its other functions.
Visualization solution: An interactive platform visualizing the genome in 2D and 3D allows users to select and compare structures of interest at varying resolutions.
Outcomes: NEWS : http://www.caltech.edu/news/visualization-brings-data-life-52802
INTERNS: Peter Polak, Aprameya Mysore, Shixie
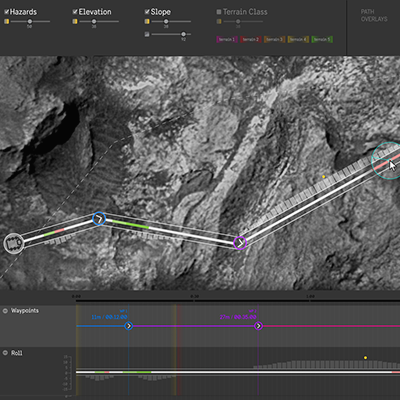
ROVER PATH PLANNING
| John Wright & Frank Hartman, JPL Rover Surface Operations
Engineering challenge: Drive the Mars Rover efficiently to points of scientific interest.
Visualization challenge: Streamline rover path planning by simultaneously visualizing terrain data, rover stability, time and distance.
Visualization solution: An intuitive tool that reduces cognitive load and enables drivers to quickly sketch, analyze and output an optimal path.
Outcomes: CASE-STUDY : http://www.peiliew.com/rsketch-1
INTERNS: John Thompson, Pei Liew, Alex Sciutto
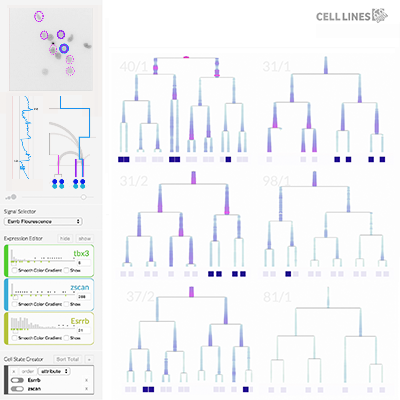
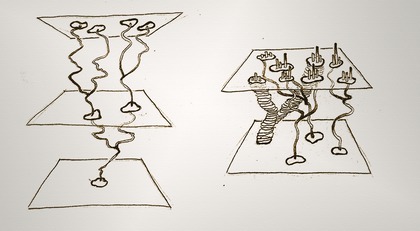
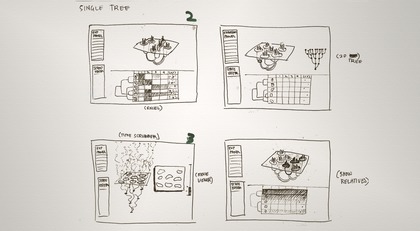
CELL LINES
| Dr. Michael Elowitz, Caltech Biology
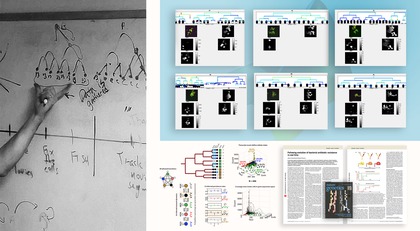
Science challenge: Understand the activity of related cells in expanding colonies.
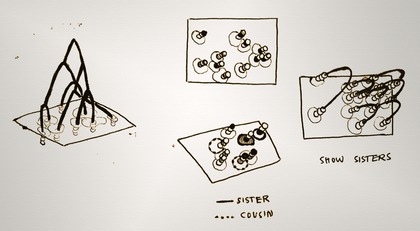
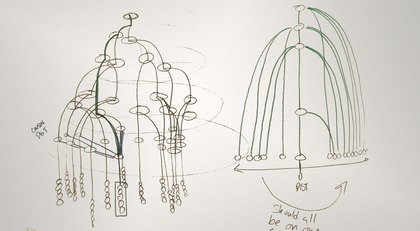
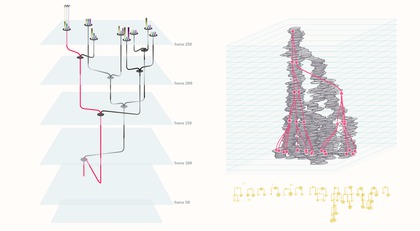
Visualization challenge: Track the lineage of gene expression in cells over time with overlapping data in movies, gene expression levels and cell lineage hierarchies.
Visualization solution: A streamlined visual tool for researchers to dynamically track, filter and compare gene expression patterns across multiple data sets at once.
Update:
*Newer version now named cellerie
Outcomes: LIVE-PORTAL : http://cellerie.caltech.edu
INTERNS: Alex Sciutto, Pei Liew
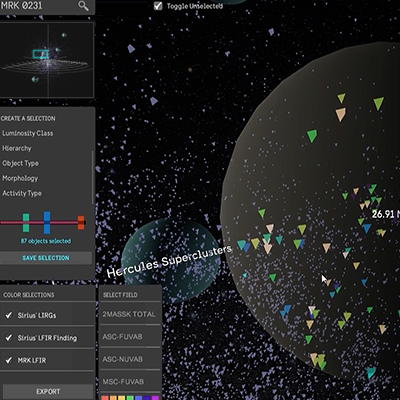
NED INTERACTIVE INTERFACE
| Dr. Joseph Mazzarella, Caltech IPAC
Science challenge: Understand how the cosmic environment effects star formation and active galactic nuclei.
Visualization challenge: Intuitively visualize spatial relataionships and parametric data cataloged in the NED (NASA/IPAC Extragalactic Database) collection of all known objects in the universe.
Visualization solution: An interactive web tool that represents the universe in 3D, allows users to select, filter and compare regions of interest.
Outcomes: CASE-STUDY : http://www.peiliew.com/n3d
INTERNS: Thomas Lu, Pei Liew, Alex Sciutto
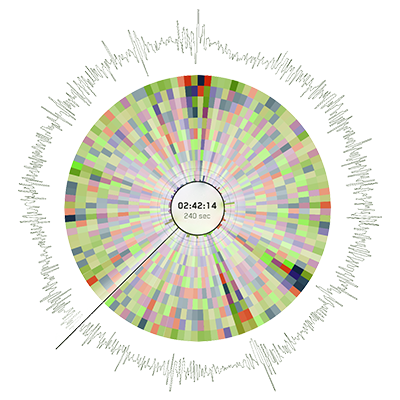
LIGO
| Dr. Rana Adhikari, Caltech Physics
Science Challenge: Discover gravitational waves.
Engineering challenge: Understand the state of a hyper-sensitive laser interferometer, instrumented with 10,000 sensors.
Visualization challenge: Summarize 10k telemetry channels to allow for real-time machine diagnostics and post-hoc scientific discovery.
Visualization Solution: A streamlined interface that identifies outliers, visually codifies data channels (including video+sound), and enables pattern discovery.
Outcomes: NEWS : https://eands.caltech.edu/2015/03/19/dialing-in-to-noise/ : VIDEO : https://vimeo.com/120269583
INTERNS: Bill Lindmeier, Stephen Bader, Luna Lie
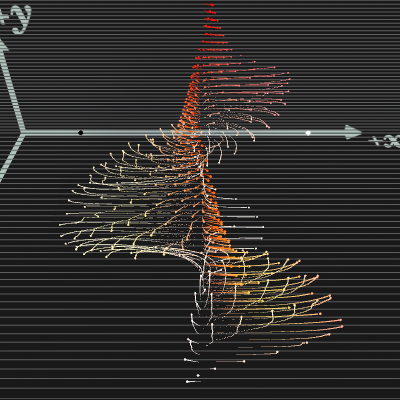
FLUID DYNAMICS
| Dr. Beverley McKeon, Caltech Aerospace
Science Challenge: Manipulate wall-bounded fluid flow to improve vehicle performance.
Visualization problem: Visualize of the building blocks of wall turbulence, an otherwise apparently chaotic flow phenomenon.
Visualization solution: Specially-designed software permits a single building block, essentially a three-dimensional, propagating wave, to be visualized using velocity vectors and particle traces. The flow history identified via particle traces reveals rotational structure.
Outcomes: VIDEO : https://vimeo.com/120269583
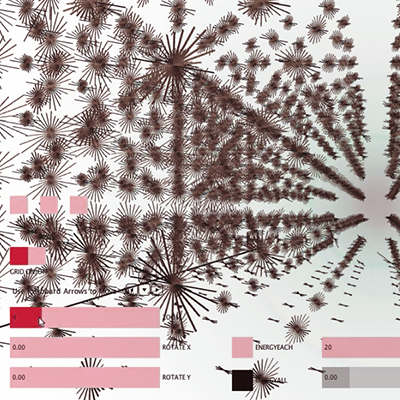
NEUTRON SCATTERING
| Dr. Brent Fultz, Caltech Physics
Science challenge: Understand heat transfer through solid crystals.
Visualization problem: Present a 5-dimensional space showing (3 dimensions of momentum, energy and spin), and allow interaction and dynamic filtering.
Visualization solution: An interactive tool to explore the volume and provides control over the amount of information seen at one time.
Outcomes: VIDEO : https://vimeo.com/120269582
INTERNS: Ju Park, Stephen Bader, Luna Lie



 Krys Blackwood |
Scott Davidoff |
Maggie Hendrie |
Santiago Lombeyda |
Hillary Mushkin
Krys Blackwood |
Scott Davidoff |
Maggie Hendrie |
Santiago Lombeyda |
Hillary Mushkin